Good introductions on this topic
-
See the Essential Statistics lecture notes, chapter on descriptive statistics
-
http://www.uni-kiel.de/psychologie/rexrepos/rerDescriptive.html
Some examples in R
Correlations tests
Correlation tests measure the relationship between variables. This relationship can goes from +1 to -1, where 0 means no relation. Some of the tests that we can use to estimate this relationship are the following:
-Pearson’s correlation is a parametric measure of the linear association between 2 numeric variables (PARAMETRIC TEST)
-Spearman’s rank correlation is a non-parametric measure of the monotonic association between 2 numeric variables (NON-PARAMETRIC TEST)
-Kendall’s rank correlation is another non-parametric measure of the associtaion, based on concordance or discordance of x-y pairs (NON-PARAMETRIC TEST)
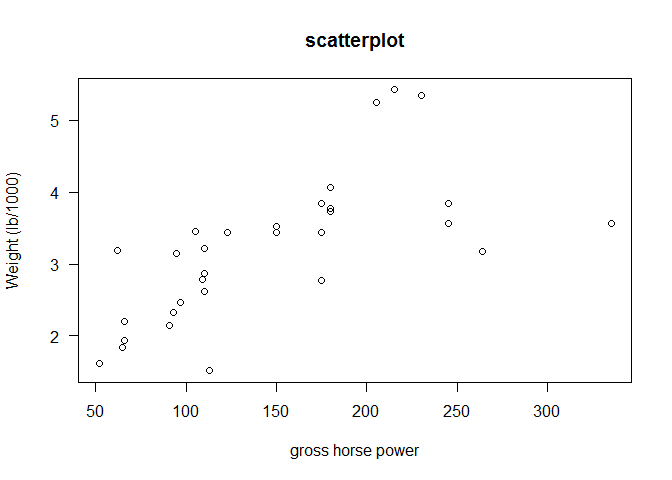
attach(mtcars)
plot(hp, wt, main="scatterplot",las=1, xlab ="gross horse power", ylab="Weight (lb/1000)")

Compute the three correlation coefficients
cor(hp, wt, method="pearson")
## [1] 0.6587479
cor(hp, wt) #Pearson is the default method; the order of variables is not important
## [1] 0.6587479
cor(hp, wt, method="spearman")
## [1] 0.7746767
cor(hp, wt, method="kendal")
## [1] 0.6113081
Test the null hypothesis, that means that the correlation is 0 (there is no correlation)
cor.test(hp, wt, method="pearson") #Pearson correlation test
##
## 	Pearson's product-moment correlation
##
## data:  hp and wt
## t = 4.7957, df = 30, p-value = 4.146e-05
## alternative hypothesis: true correlation is not equal to 0
## 95 percent confidence interval:
##  0.4025113 0.8192573
## sample estimates:
##       cor
## 0.6587479
cor.test(hp, wt, method="spearman")
## Warning in cor.test.default(hp, wt, method = "spearman"): Cannot compute
## exact p-value with ties
##
## 	Spearman's rank correlation rho
##
## data:  hp and wt
## S = 1229.364, p-value = 1.954e-07
## alternative hypothesis: true rho is not equal to 0
## sample estimates:
##       rho
## 0.7746767
#Spearmn is a non-parametric, thus it is not possible to get CIs. There is a error message because R cannot compute exact p values (the test is based on ranks, we have few cars with the same hp or wt).
#We can get rid off the warning letting R know that approximate values are fine
cor.test(hp, wt, method="spearman", exact=F)
##
## 	Spearman's rank correlation rho
##
## data:  hp and wt
## S = 1229.364, p-value = 1.954e-07
## alternative hypothesis: true rho is not equal to 0
## sample estimates:
##       rho
## 0.7746767
cor.test(hp, wt, method="kendal", exact=F) #same happens with Kendal correlation test
##
## 	Kendall's rank correlation tau
##
## data:  hp and wt
## z = 4.845, p-value = 1.266e-06
## alternative hypothesis: true tau is not equal to 0
## sample estimates:
##       tau
## 0.6113081
When we have non-parametric data and we do not know which correlation method to choose, as a rule of thumb, if the correlation looks non-linear, Kendall tau should be better than Spearman Rho.
Further handy functions for correlations
Plot all possible combinations with pairs
pairs(mtcars) # all possible pairwise plots

To make it simpler we select what we are interested
names(mtcars)
##  [1] "mpg"  "cyl"  "disp" "hp"   "drat" "wt"   "qsec" "vs"   "am"   "gear"
## [11] "carb"
pairs(mtcars[,c(1,4,6)]) # subsetting the categories we will use

Building a correlation matrix
cor(mtcars)
##             mpg        cyl       disp         hp        drat         wt
## mpg   1.0000000 -0.8521620 -0.8475514 -0.7761684  0.68117191 -0.8676594
## cyl  -0.8521620  1.0000000  0.9020329  0.8324475 -0.69993811  0.7824958
## disp -0.8475514  0.9020329  1.0000000  0.7909486 -0.71021393  0.8879799
## hp   -0.7761684  0.8324475  0.7909486  1.0000000 -0.44875912  0.6587479
## drat  0.6811719 -0.6999381 -0.7102139 -0.4487591  1.00000000 -0.7124406
## wt   -0.8676594  0.7824958  0.8879799  0.6587479 -0.71244065  1.0000000
## qsec  0.4186840 -0.5912421 -0.4336979 -0.7082234  0.09120476 -0.1747159
## vs    0.6640389 -0.8108118 -0.7104159 -0.7230967  0.44027846 -0.5549157
## am    0.5998324 -0.5226070 -0.5912270 -0.2432043  0.71271113 -0.6924953
## gear  0.4802848 -0.4926866 -0.5555692 -0.1257043  0.69961013 -0.5832870
## carb -0.5509251  0.5269883  0.3949769  0.7498125 -0.09078980  0.4276059
##             qsec         vs          am       gear        carb
## mpg   0.41868403  0.6640389  0.59983243  0.4802848 -0.55092507
## cyl  -0.59124207 -0.8108118 -0.52260705 -0.4926866  0.52698829
## disp -0.43369788 -0.7104159 -0.59122704 -0.5555692  0.39497686
## hp   -0.70822339 -0.7230967 -0.24320426 -0.1257043  0.74981247
## drat  0.09120476  0.4402785  0.71271113  0.6996101 -0.09078980
## wt   -0.17471588 -0.5549157 -0.69249526 -0.5832870  0.42760594
## qsec  1.00000000  0.7445354 -0.22986086 -0.2126822 -0.65624923
## vs    0.74453544  1.0000000  0.16834512  0.2060233 -0.56960714
## am   -0.22986086  0.1683451  1.00000000  0.7940588  0.05753435
## gear -0.21268223  0.2060233  0.79405876  1.0000000  0.27407284
## carb -0.65624923 -0.5696071  0.05753435  0.2740728  1.00000000
cor(mtcars[,c(1,4,6)])
##            mpg         hp         wt
## mpg  1.0000000 -0.7761684 -0.8676594
## hp  -0.7761684  1.0000000  0.6587479
## wt  -0.8676594  0.6587479  1.0000000
detach(mtcars)